Candlestick Charts з маскотом Nova
Пілотний модуль: під кожен текстовий блок уроку — своя картинка, усі з одного рецепта й з одним персонажем. Сім кадрів навмисне без маскота: там, де сенс блоку — сама схема, персонаж тільки заважає.
Маскот
Зліва — лист персонажа від клієнта, справа — наш канонічний кадр із нашої 5090. Саме він (погрудним кропом) лежить у референс-слоті кожної картинки нижче.
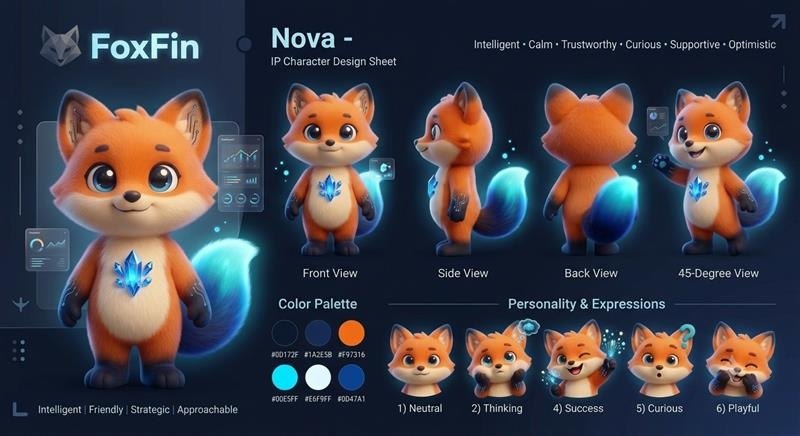
Лист клієнта

Наш канонічний кадр
Урок 1.1 · What one candle is made of
8 блоки тексту, 8 ілюстрації.

Where each candle comes from Every candlestick chart compresses stretches of trading into a row of small shapes. Read one shape properly and you know what the two sides of the market did with the price in that slice of time.

Pull a single candle off the chart and it splits into two pieces. The thick middle block is the body. The hairline stubs poking out of each end are the wicks, sometimes called shadows. Start with the block in the middle.

Both ends of that block are prices with a timestamp on them: one marks where the period opened (1), the other where it closed (2). Trading began at the first number and stopped at the second. How far apart they sit decides how tall the block stands, and which color it gets.

Charts paint the block green, or hollow white, when the closing number finished above the opening one, so the period ended up. They paint it red, or solid black, when it finished underneath, so the period ended down.

No. That block measures open against close, nothing else. The extremes of the period live outside it.
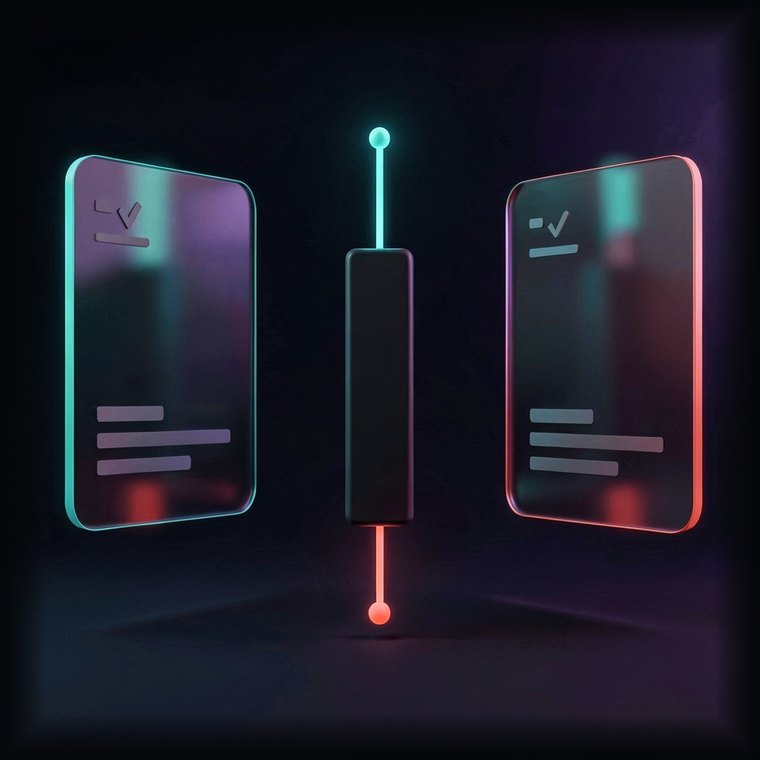
Those hairlines are the wicks. One climbs off the top of the block to the dearest price paid in the period (1); the other drops off the bottom to the cheapest (2).

Proportions carry the message. A tall block says one side leaned hard on the market for most of the period. Stubby hairlines say price never wandered far from the two numbers that formed the block.

That is the whole anatomy. One candle is a compressed report on one period: the block gives you the two prices that bracket it, open and close, and the two hairlines give you how far the market strayed in each direction. Learn to lift those four numbers off a shape and the chart starts talking.
Урок 1.2 · Who won the period
11 блоки тексту, 11 ілюстрації.

Color as a scoreboard Color is the fastest read on a chart. A green block reports a period that finished above where it began; a red one reports a period that finished below.

Green shows up when the closing number lands above the opening one. Demand outran supply for that stretch, so each new trade had to clear at a slightly better level than the one before it.

Red is the mirror image: the closing number lands under the opening one, because owners were keen enough to get out that they kept accepting worse levels.

Finish above the open and the block comes out green. That is what bullish looks like on a chart: the bid side set the terms.

Bullish describes a crowd that is comfortable paying up. When the size people want to own exceeds the size on offer, orders only get filled by reaching for higher and higher levels.

Bearish is the reverse crowd: owners want out badly enough to shave their asking levels. Once the size for sale swamps the size wanted, every fill happens a little lower than the last one.

Height scales conviction. A deep block means one crowd kept its foot down the whole period; a sliver of a block means both crowds ended up roughly where they started, unable to settle anything.

The hairlines qualify that verdict. Green block with a long line above it: demand carried the period, and yet somewhere near the top it ran into enough offers to give part of the gain away.

Flip it. Red block with a long line beneath it means supply carried the period, but bids waiting down there took back some of the drop. The hairlines are where the argument actually happened.
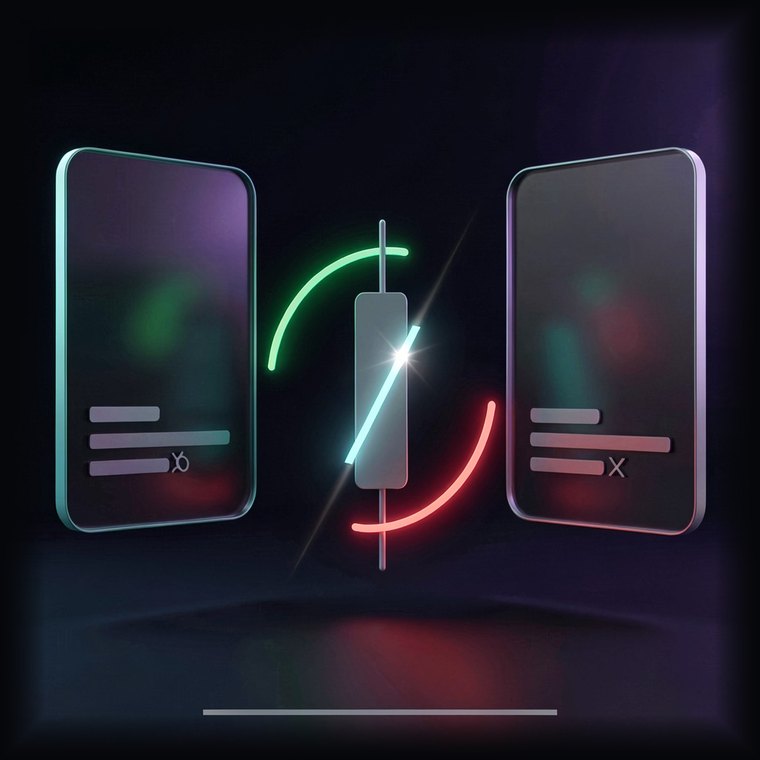
A sliver says the opposite. The period churned and then finished about where it opened, so nobody managed to move the level anywhere in particular.

Color, height, hairlines: three readings off one shape. Color tells you which crowd finished ahead. Height tells you by how much, which stands in for how sure that crowd was. Hairlines tell you where the other crowd pushed back, and how hard. Put the three together and a candle stops being decoration and becomes a short account of a negotiation.
Урок 1.3 · Shapes worth knowing by name
11 блоки тексту, 11 ілюстрації.

Shapes that show up again and again A handful of candle shapes get their own names because traders keep watching for them at turns. Four of them do most of the work, so take them one at a time.

A Doji is what you get when a period opens and closes at almost the same number. The block collapses to a line. Neither crowd finished ahead of the other.

Read a Doji as a stalemate. The period had motion but no resolution, which is why these often print where a run is losing steam, or just before price drifts sideways for a while.

A Hammer carries its small block up near the high with one long hairline hanging below. You tend to find it at the tail of a slide, where bids finally turned up underneath the market.

The shape records a round trip inside one period: the level got dumped, then bought back, closing within a whisker of where it opened. Selling took the first half; the second half undid it.

Turn a Hammer upside down and you get a Shooting Star: block down near the low, one long hairline stretching up. It prints after a climb, where offers refused to let the level hold up there.

Inside that period the level got lifted, met a wall, and came all the way back to finish near its open. Whoever bought near the top had the gain taken away before the close.

The Gravestone Doji is the extreme version: no block at all, just a line above. Open, close and the low sit together at the bottom, and every attempt at a higher level failed outright.

It tells you the opposite. Demand got the first move and then lost it, and the length of that hairline measures exactly how much ground the offers took back.

The Dragonfly Doji is its twin, flipped: no block, one long hairline below. The level was marked down through the period, then bid all the way back, so open, close and the high land together on top.

Four shapes, three messages. A Doji reports a period nobody won, which matters most where a run has been going one way for a while. A Hammer at the bottom of a slide says bids turned up. A Shooting Star after a climb says offers turned up. And every one of those readings leans on what came before it: the same shape in a different setting means something else entirely.
Урок 1.4 · Where the shape appears
13 блоки тексту, 13 ілюстрації.

Setting outranks shape One shape, two locations, two different meanings. Knowing where a candle printed is how you sort the readings worth acting on from the ones that are just noise wearing a familiar outline.

The reason is that a chart records decisions, not physics. A shape means something when it sits where plenty of people were already making up their minds; anywhere else it is only the arithmetic of four prices.

Take a Hammer landing at the end of a long slide. By then most of the people who wanted out have already gone, so the supply that had been driving the move is thinning. A period that gets sold down and bought straight back is the first visible sign of that.

That identical shape halfway up a rising market barely registers. Nothing was revealed that was not already true, since the bid side was in charge before the candle and stays in charge after it.

Location supplies the meaning. A stalled period arriving at the end of a hard run reads as fatigue. The very same stalled period in the middle of a flat stretch reads as an ordinary quiet day.

Price levels add a second layer. The zones where the market has turned before are the ones traders wrote down, and written-down prices are where decisions cluster.

A shape forming on one of those zones inherits all that attention. A Hammer sitting on a well-tested floor is not one trader's opinion, it is a pile of resting orders getting filled in the same place at the same time.

Drop the same Hammer into empty space between zones and the crowd effect disappears. Nobody was watching that price, so nothing about the shape carries past the period it describes.

The clock matters too. A shape built out of a whole day of trading rests on far more committed money than one built out of a few minutes, and it survives the next hour more often.

Timeframes can also agree with each other. When the daily chart and the weekly chart print the same message at the same level, you are looking at one conclusion reached twice, by two different sets of participants.

The best setups are the ones where every layer says the same thing at once. That agreement has a name, confluence, and it means the run, the level and the clock all point one way.

Concretely: a slide that has gone on long enough to tire itself out, a Hammer forming right on a floor the market has respected before, and the whole thing printed on a daily bar. Three separate reasons, one direction.

A candle on its own is arithmetic; a candle in a setting is information. Shapes gain weight when they arrive late in a run, land on a price the market has already argued over, and come off a clock slow enough to represent real participation. When those three line up, you have your best odds. When they do not, you have a shape and nothing more. Check the run, the level and the timeframe before acting on any of them.
Урок 1.5 · Reading live charts
3 блоки тексту, 3 ілюстрації.

Now do it on a chart Everything so far comes together here. Work through the charts below and call each one using what the block, the color, the shape and the surroundings tell you.

Reading a live chart is these four passes run in order. First the shape: what the block and hairlines say about one period. Then color and height: which crowd finished ahead, and how convincingly. Then the name, if the shape has one. Last the setting, because where a shape prints decides how much the rest of it is worth.

Want the next layer, where shapes combine across several periods and get read inside a full system, with practice on virtual funds along the way? The 28-Day Trading Challenge picks up where this mini-course stops.